Simulating Battery Physics in the Browser
How we built an interactive BESS simulator to understand an industry we knew nothing about
We didn't know anything about battery energy storage systems six weeks ago.
Now I can tell you about state of charge curves, thermal derating, round-trip efficiency losses, and why LFP chemistry behaves differently at 35°C than at 25°C.
We didn't learn this from a textbook. We learned it by building a simulator.
The Challenge
Battery storage is having a moment. Grid-scale BESS installations are growing 40%+ year over year. Every energy company is talking about storage. But the physics are genuinely complex:
- •Batteries don't charge and discharge linearly
- •Temperature affects everything: capacity, efficiency, lifespan
- •Degradation is a slow killer that's hard to see until it's too late
- •Weather, load, and grid prices all interact in real-time
We wanted to feel these dynamics, not just read about them. So we built something.
What we built
An interactive, real-time battery storage simulator that runs entirely in the browser.
You can:
- •Watch power flow from solar/wind → battery → load → grid in real-time
- •Trigger weather events and see how generation responds
- •Switch between load profiles (residential, commercial, industrial)
- •Choose dispatch strategies (self-consume, time-of-use, grid support)
- •See the financial impact as it happens
It's not connected to real data. It's a physics sandbox, a way to build intuition.
The Physics Model
Here's what's actually being calculated every simulation tick:
Power Flow
Net power = Solar generation + Wind generation - Load demand
If net > 0 → Charge battery (limited by max charge rate, available capacity)
If net < 0 → Discharge battery (limited by max discharge rate, available energy)
Overflow/deficit → Grid import or export
Simple in concept. But the limits are where it gets interesting.
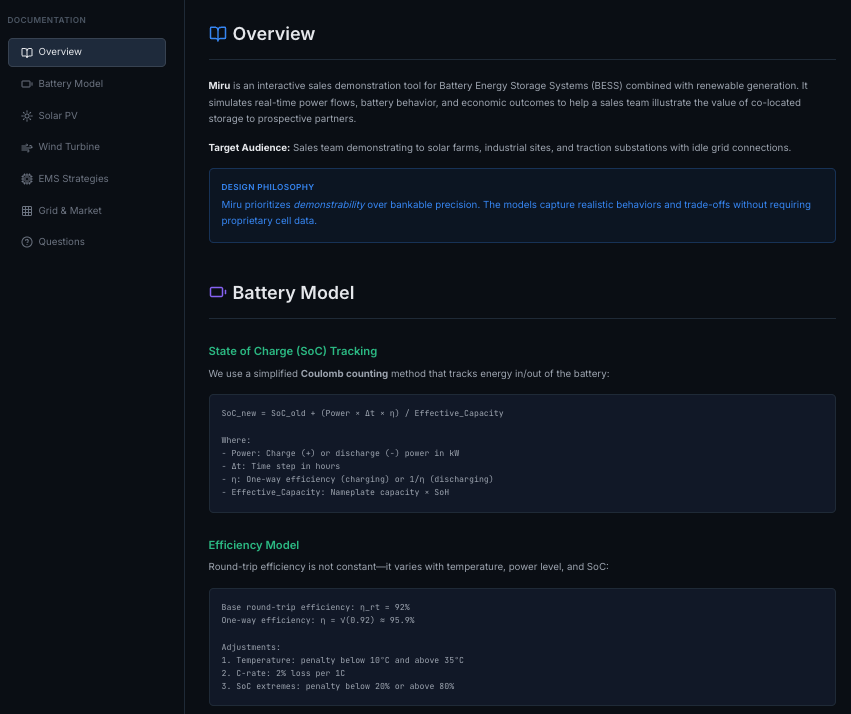
State of Charge (SoC)
Batteries aren't buckets. You can't just pour energy in and take it out.
Charging:    Energy stored = Power × Time × Charging efficiency (~94%)
Discharging: Energy delivered = Power × Time × Discharging efficiency (~94%)
Round-trip:  ~88% (you lose 12% to heat)
That 12% loss compounds. Over a year of daily cycling, it's significant.
SoC rising during solar peak
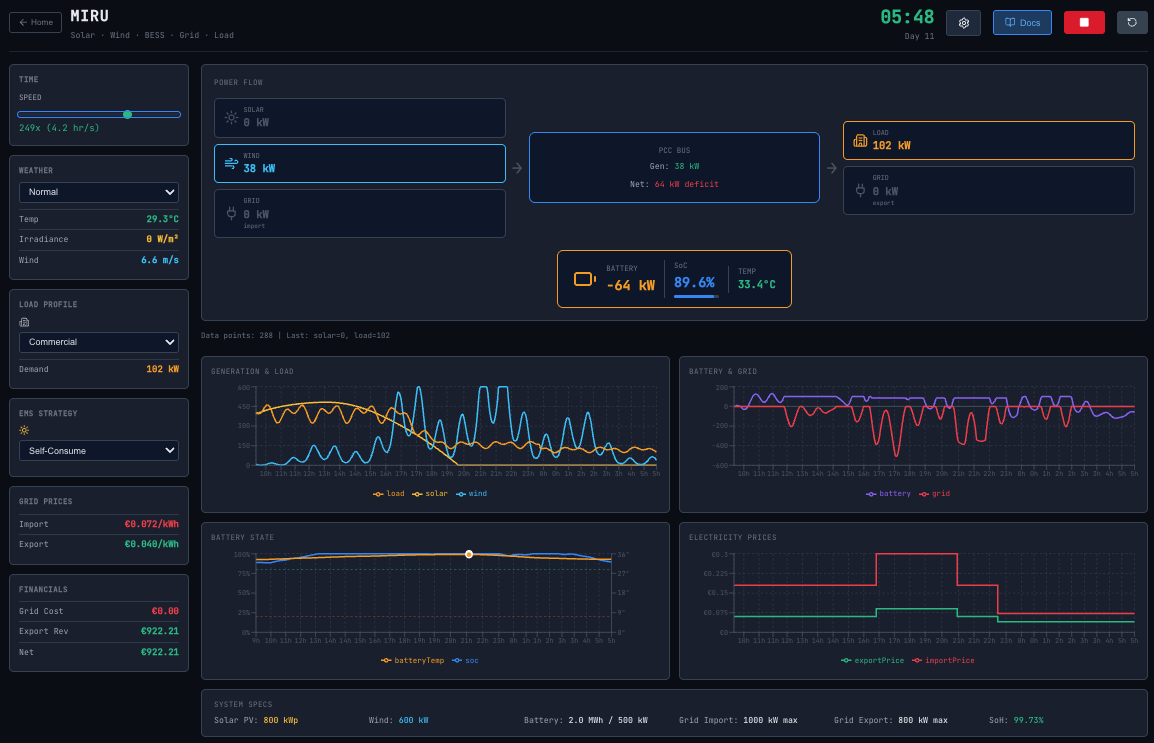
SoC falling during evening demand
Thermal Dynamics
This is where most simple models fall short. Temperature affects:
- Capacity:Batteries hold less charge when cold
- Efficiency:Losses increase at temperature extremes
- Power limits:Systems derate (reduce max power) when hot
- Degradation:Heat accelerates aging exponentially
We modeled the battery as a thermal mass:
Temperature change = (Heat generated - Heat dissipated) / Thermal mass
Heat generated = Power × (1 - Efficiency)
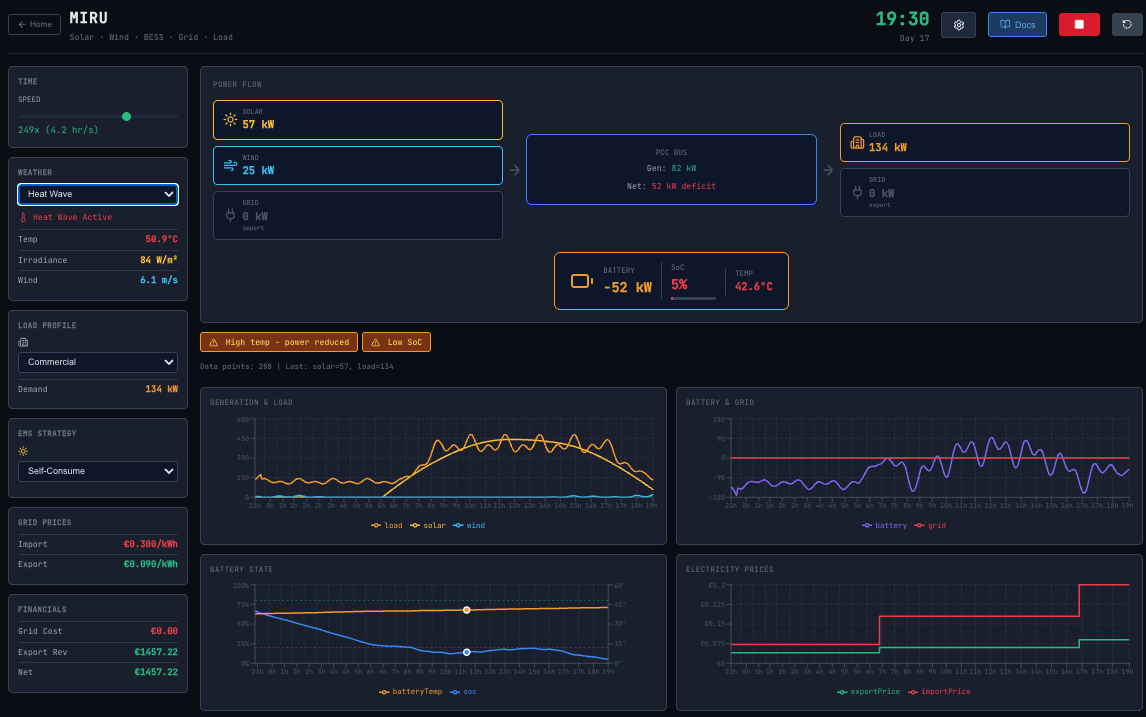
Heat dissipated = Cooling coefficient × (Battery temp - Ambient temp)When you run the simulator on a hot day with aggressive cycling, you can watch the battery temperature climb, and see the system automatically derate to protect itself.
Degradation
Batteries die two ways:
- 1.Cycle degradation: Every charge/discharge wears the cells
- 2.Calendar aging: Time itself degrades capacity, faster when hot
Cycle degradation = 0.02% per full equivalent cycle
Calendar aging = ~2% per year at 25°C (doubles every 10°C increase)
In the simulator, you can run time at 60x speed and watch the State of Health (SoH) slowly decline over simulated months.
Design Decisions
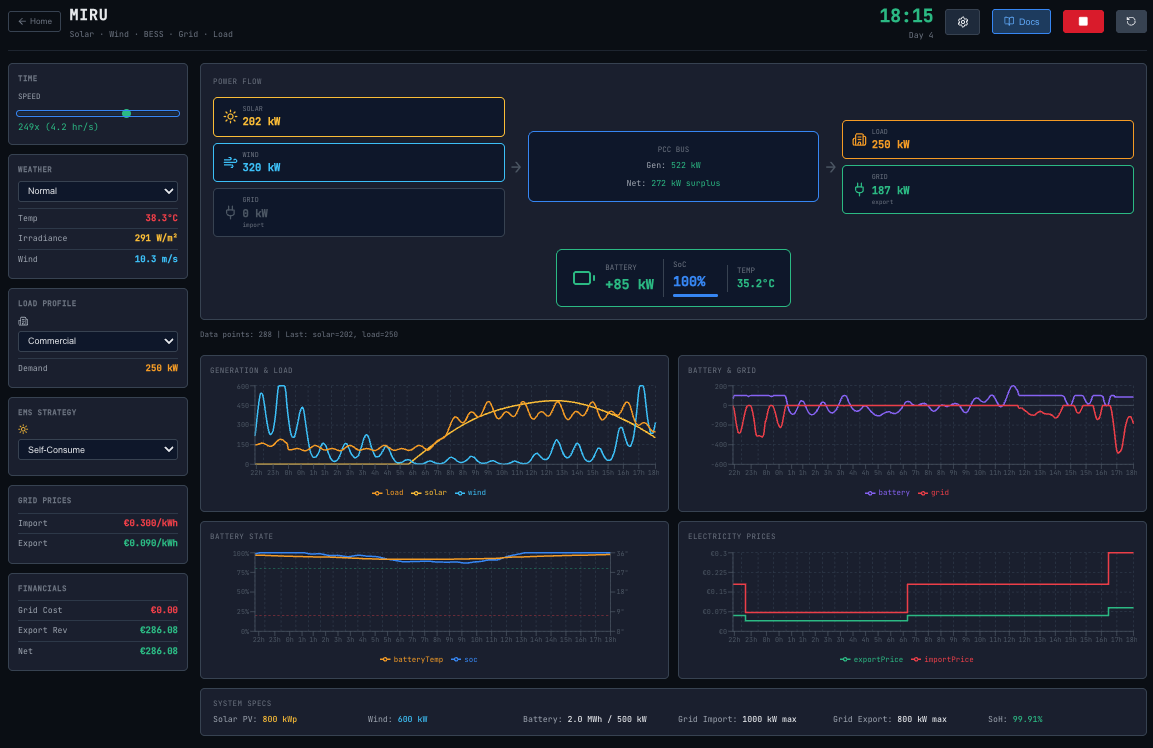
Real-time, not static
We could have built a calculator: input parameters, get results. But that doesn't build intuition.
Watching the power flow animation (seeing solar ramp up at sunrise, the battery absorb the excess, then discharge into the evening peak) teaches you something a spreadsheet never will.
Visible physics, not black boxes
Every parameter is exposed. You can see the efficiency losses. You can see the thermal response. Nothing is hidden.
The docs page lists every assumption:
- •Battery capacity: 2,000 kWh
- •Max power: ±500 kW
- •Round-trip efficiency: 87%
- •Thermal mass: equivalent to mass × specific heat
- •All sources cited
If an expert looks at this and says "your thermal model is too simple," good. That's the conversation I want.
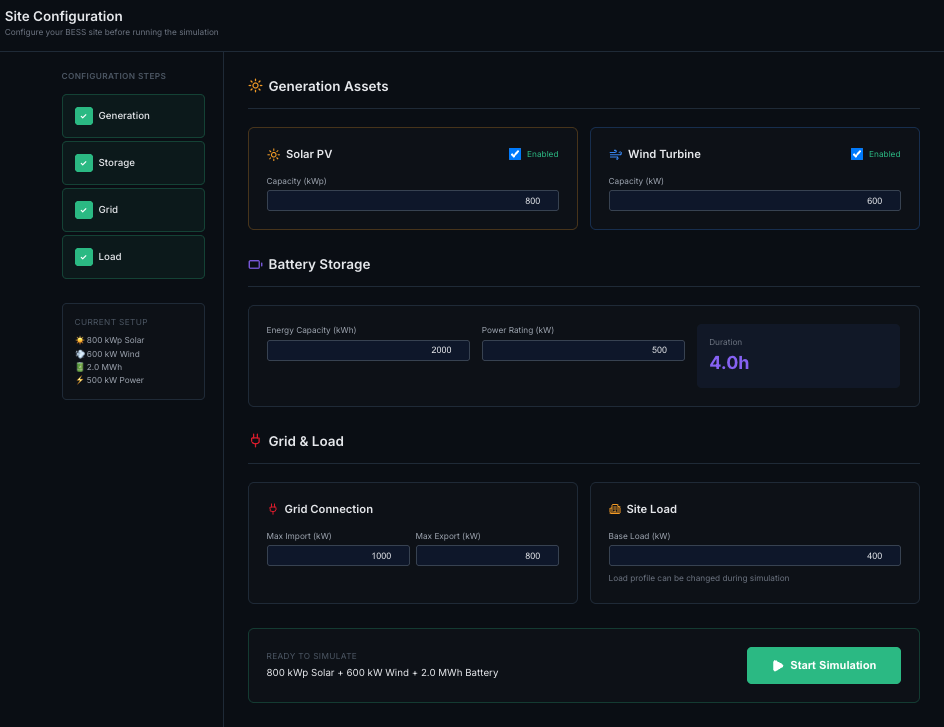
Configurable, not fixed
Different batteries behave differently. Different sites have different constraints. The simulator lets you adjust:
- •System size (power and energy)
- •Efficiency curves
- •Weather patterns
- •Load profiles
- •Dispatch strategies
It's a sandbox, not a single scenario.
What we learned
Building this taught me more than any report could:
1. Round-trip efficiency is a bigger deal than we expected.
Losing 12% on every cycle means you need significant price spreads to make arbitrage work.
2. Thermal management is non-negotiable.
Batteries in hot climates need active cooling. The economics change completely.
3. Degradation is the silent killer.
A battery that looks fine today might be significantly impaired in 5 years. Modeling this is essential for long-term contracts.
4. Dispatch strategy matters enormously.
The same battery can earn very different returns depending on how it's operated.
Try It Yourself
The simulator is live at miru-explore.vercel.app.
Click into "Operations Simulation" and play with it. Run time at 60x. Trigger a heat wave. Switch to industrial load. See what happens.
And if you spot something wrong with the physics, tell us. That's how we learn.